Building a FOSS SOC Lab
🗓️ October 1st, 2023
📝 Last Updated: December 31st, 2024
⏳ 12 min. read
2024-12-31 Update: As of July 3rd 2024, there is now official documentation by Wazuh for integrating IRIS with Wazuh. I highly recommend that you follow that documentation.
2024-05-19 Update: As of IRIS versions
2.4.xand greater, changes were made to access control which requires an extra step for the Wazuh-IRIS integration. See the steps here.
Table of Contents
Earlier this year, I set up my own SOC, or Security Operations Center, as a way to obtain further hands-on experience on network offense & defense concepts, and to also defend my home network. I chose various free and open-source tools to create this platform, as I plan to use, manage, and evolve it long-term.
This write-up serves as a high-level overview of the tools that were chosen for this lab, how I went about implementing them, and an in-depth look on how I devised a workflow/playbook for analyzing incidents.
Why not Security Onion?
Security Onion is a FOSS Linux distribution and all-in-one security platform that brings a lot of the components required for a SOC. The main reason I chose not to just deploy it and call it a day was that I found there to be greater value in choosing and deploying each component of the SOC myself, as in the future, for example, Security Onion can choose to remove/add components, and I would like the autonomy long-term to decide that for myself. Additionally, with my system administration experience, I figured it would also be beneficial to learn the security engineering aspects of setting up these tools.
Lastly, the hardware requirements are pretty hefty for a standalone deployment, stating a minimum of 24 GB of RAM. In contrast, all the tools I’ve chosen for this lab run well on an old ThinkPad laptop with 8 GB of RAM.
It’s not to say that I think Security Onion is a bad option, in fact I would actually recommend it for most people wanting to learn the skills of a SOC analyst; it’s just that ultimately I would like for this platform to be modular and give me the ability to customize it as I see fit, without the additional overhead that Security Onion brings.
With all that out of the way, let’s move on to the architecture and setup of the lab.
Architecture Overview + Setup
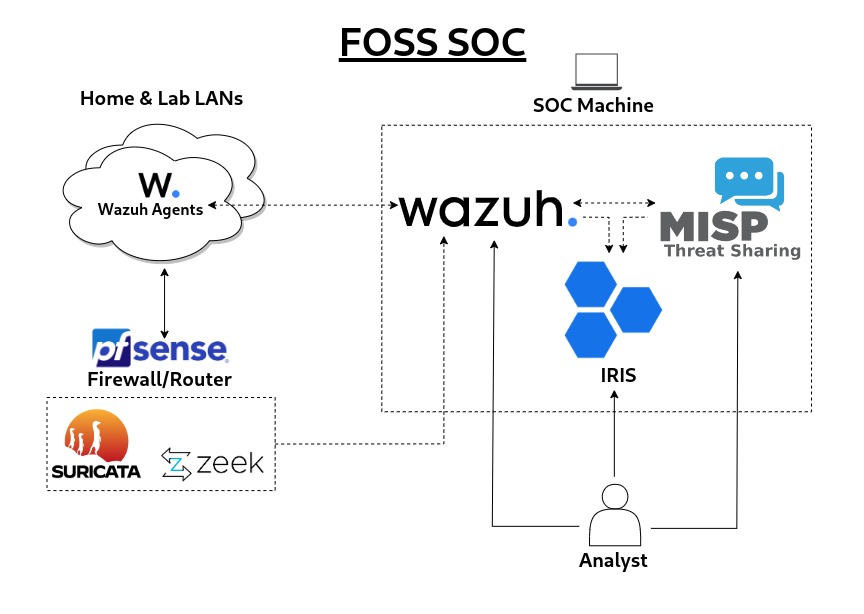
Most of the components of the SOC were installed on a single machine bearing 8 GB of RAM, a 6+ year old quad-core Intel CPU, and 500 GB of storage on a SATA SSD. I chose Rocky Linux as the operating system, but the tools should work on most GNU/Linux distributions.
The Network monitoring tools were installed on the pfSense firewall/router on my network, since that is where all traffic on the various segmented networks passes through already, so that removed the need to implement something like a TAP or SPAN (at least for my use case).
Once all the tools have been set up, the SOC architecture looks like this:
Wazuh - SIEM/XDR/Vulnerability Management
Wazuh is a XDR/SIEM security platform with a multitude of capabilities, such as intrusion detection, log data analysis, vulnerability detection, incident response, regulatory compliance, and more. The Wazuh agent additionally allows for malware detection and file integrity monitoring to be performed on a multitude of endpoint types.
Although not as popular as other well-established SIEMs, Wazuh is proving to be great FOSS alternative that appears to be steadily closing the gap. Naturally, it does not have all the bells and whistles that some commercial solutions have, that may be of more importance to enterprise/complex environments.
This will be the “core” of the platform, as all vital endpoints within the network will be monitored via Wazuh, whether using the Wazuh agent or forwarding the devices’/services’ logs to Wazuh via syslog and allow for event correlation to be performed.
I installed Wazuh following their quickstart guide, which installed all the Wazuh central components on the machine via an automated script. I had to make a minor change to the installation script modifying the line DIST_NAME=$ID to a hard-coded value of DIST_NAME=rhel, as the script does not appear to natively support all derivatives of RHEL. Since Rocky Linux aims to be “bug-for-bug compatible” with RHEL, I figured making this change would not be problematic. After this change, the script was able to run and install+start all the components without any issues.
Finally, the Wazuh agents were deployed on several endpoints, following the corresponding instructions for each endpoint’s operating system. For endpoints that didn’t support the agent (such as network devices), syslog collection was configured and enabled.
Suricata - Network Monitoring/IDS
A well-known network intrusion detection/prevention system (NIDS), Suricata plays a vital role in monitoring the network side of things for any threats, and forwarding its logs to Wazuh.
This along with Zeek below helps provide a comprehensive overview of the type of activity that is occurring on the network.
Since Suricata is available as a package for pfSense, installing it was a breeze. All that was left was to enable the ET OPEN and Snort GPLv2 community rulesets, configure monitoring on the desired interfaces, enabling the Log to System Log feature, and later tune the rules for any false positives. Blocking/IPS mode was not enabled due to the aforementioned false positives.
Zeek - Network Metadata Monitoring/Anomaly Detection
Another network monitoring tool, Zeek is able to analyze traffic and create event/transaction logs, of which these also be forwarded to Wazuh.
Similar to Suricata, Zeek was also installed on pfSense via the package manager. The setup was also pretty straight-forward, only needing to choose the interfaces that were to be monitored.
MISP - Threat Intelligence/IOCs
MISP is a mature threat intelligence and sharing platform, and serves as an information base for any indicators of compromise (IOCs), malware samples, incidents, and more.
Wazuh will be able to enrich logs by taking advantage of the MISP API to automatically send requests containing potential IOCs, of which MISP then responds with details on the IOC. A positive response from MISP will then generate an alert in Wazuh, which would subsequently also create a ticket in IRIS, the incident response and ticketing platform, further described below.
MISP was easily installed via their official Docker container. Afterwards, within MISP, the default feed metadata was downloaded and enabled, the scheduler was enabled, and a scheduled task was configured to automatically update the feeds daily.
IRIS - Incident Response/SOAR/Case Management
A promising incident response platform, IRIS provides case management and automation to help keep track of events and triage incidents. IRIS can also integrate with MISP and Wazuh to enrich its data sources and automatically create tasks/tickets based on the alerts received.
As such, IRIS will be first and main tool that we as the SOC analyst will work with to investigate any anomalies on the network, moving to Wazuh and MISP when we need to dig deeper for more information. IRIS will also serve as the ticketing system when assessing incidents and as a way to add documentation to each case.
Once again, IRIS was installed in just a few steps, as they also provide a Docker container.
Workflow Setup
After all the tools were set up and configured, all that was left was to make them talk to each other in order to add some automation to the detection and analysis of incidents.
pfSense - Syslog
As discussed previously, syslog will be used to forward pfSense (and subsequently Suricata and Zeek) logs to Wazuh. The syslog-ng package was installed, since there is no option for Zeek to log to the pfSense system log as with Suricata, and the native syslog server does not allow for one to forward additional log files other than the system log. Utilizing this Reddit comment as reference for syslog-ng objects, I created various objects that defined the specific log files to forward, any additional metadata to add, and the Wazuh server as the destination.
The following shows the source, object created to forward the pfSense logs:
- Object Name:
pfsense - Object Type:
Source - Object Paramaters:
{
    file(
        "/var/log/system.log"
        flags(no-parse)
    );
};
Next, the below destination object was created to define where to send the logs to:
- Object Name:
wazuh - Object Type:
Destination - Object Parameters:
{
    network(
        "192.168.1.15"
        port(514)
        transport(udp)
        flags(syslog-protocol)
    );
};
To finish this, a log object is created that combines the above source and destination objects:
- Object Name:
log_pfsense - Object Type:
Log - Oject Parameters:
{
    source(pfsense);
    destination(wazuh);
};
Now, 3 more objects were created in order to forward the Zeek (conn.log in this instance) logs to Wazuh:
Zeek source object:
- Object Name:
zeek_conn - Object Type:
Source - Object Parameters:
{
    file(
        "/usr/local/logs/current/conn.log"
        flags(no-parse)
    );
};
Zeek rewrite object (In order to add metadata to the log indicating that it is a Zeek conn.log):
- Object Name:
rw_zeek_conn - Object Type:
Rewrite - Object Parameters:
{
    set("zeek_conn" value(".SDATA.meta.service"));
};
Zeek log object:
- Obejct Name:
log_zeek_conn - Object Type:
Log - Object Parameters:
{
    source(zeek_conn);
    rewrite(rw_zeek_conn);
    destination(wazuh);
};
Zeek does have many more log files, so the above steps were repeated for the following:
weird.lognotice.logntp.logssl.logfiles.loghttp.logstats.logdns.logdhcp.logx509.log
With syslog finally configured, Wazuh should be receiving both pfSense system logs (which includes Suricata) and Zeek logs, and will appear as:
{"timestamp":"2023-09-20T14:45:50.600-0400","agent":{"id":"000","name":"wazuh-server"},"manager":{"name":"wazuh-server"},"id":"1695218390.49858","full_log":"1 2023-09-20T14:45:50-04:00 pfSense - - - [meta sequenceId=\"90\"] Sep 20 14:39:49 pfSense php-fpm[415]: /index.php: Successful login for user 'nate' from: 192.168.1.3 (Local Database)","decoder":{},"location":"192.168.1.1"}Wazuh syslog decoders and rules
Now with syslog fully configured, decoders and rules were created in order for Wazuh to be able to parse the logs configured above and generate the corresponding alerts in Wazuh.
With help from this blog post from SOCFortress and the official Wazuh documentation for their regex syntax, I was able to create custom decoders to parse out the logs.
The /var/ossec/etc/decoders/local_decoder.xml file was edited to include the following:
<decoder name="pfsense">
        <prematch>^\d \d\d\d\d-\d\d-\d\dT\d\d:\d\d:\d\d-\d\d:\d\d</prematch>
</decoder>

<!-- Decode Suricata logs -->
<decoder name="pfsense_system">
    <parent>pfsense</parent>
    <regex offset="after_parent">^ (\.+) - - - [meta sequenceId="\d+"] \w\w\w \d\d \d\d:\d\d:\d\d pfSense (suricata)[\d+]: [(\.+):\d] (\.+) [Classification: (\.+)] [Priority: (\.+)] {(\.+)} (\.+):(\.+) -> (\.+):(\.+)$</regex>
    <order>router,service,gid:sid,description,class,priority,proto,src,sport,dst,dport</order>
</decoder>

<!-- Decode Zeek weird.log logs -->
<decoder name="pfsense_system">
    <parent>pfsense</parent>
    <regex offset="after_parent">^ (\.+) - - - [meta sequenceId="\d+" service="(zeek_weird)"] \d+.\d+\t(\.+)\t(\.+)\t(\.+)\t(\.+)\t(\.+)\t(\.+)\t(\.+)\t(\.+)\t(\.+)\t(\.+)$</regex>
    <order>router,service,uid,id.orig_h,id.orig_p,id.resp_h,id.resp_p,name,addl,notice,peer,source</order>
</decoder>

<!-- Decode Zeek notice.log logs -->
<decoder name="pfsense_system">
    <parent>pfsense</parent>
    <regex offset="after_parent">^ (\.+) - - - [meta sequenceId="\d+" service="(zeek_notice)"] \d+.\d+\t(\.+)\t(\.+)\t(\.+)\t(\.+)\t(\.+)\t(\.+)\t(\.+)\t(\.+)\t(\.+)\t(\.+)\t(\.+)\t(\.+)\t(\.+)\t(\.+)\t(\.+)\t(\.+)\t(\.+)\t(\.+)\t(\.+)\t(\.+)\t(\.+)\t(\.+)</regex>
    <order>router,service,uid,id.orig_h,id.orig_p,id.resp_h,id.resp_p,fuid,file_mime_type,file_desc,proto,note,msg,sub,src,dst,p,n,peer_descr,actions,email_dest,supress_for,remote_location.country_code,remote_location.region,remote_location.city,remote_location.latitude,remote_location.longitude</order>
</decoder>

...
<!-- Other Zeek *.log logs -->
...

<!-- Decode pfSense system logs -->
<decoder name="pfsense_system">
    <parent>pfsense</parent>
    <regex offset="after_parent">^ (\.+) - - - [meta sequenceId="\d+"] \w\w\w \d\d \d\d:\d\d:\d\d pfSense (\.+)[\d+]: (\.+)$</regex>
    <order>router,service,log</order>
</decoder>Note: For sake of brevity, only the weird.log and notice.log Zeek decoders are shown here.
Now, when the wazuh-logtest tool within the Wazuh dashboard is used to test the decoders (and subsequently rules), it should yield the following output:
Raw full_Log:
1 2023-09-20T11:47:57-04:00 pfSense - - - [meta sequenceId="1233"] Sep 20 11:47:56 pfSense suricata[91053]: [1:2027870:5] ET INFO Observed DNS Query to .world TLD [Classification: Potentially Bad Traffic] [Priority: 2] {UDP} 192.168.1.10:45430 -> 192.168.1.1:53Wazuh-logtest output:
**Phase 1: Completed pre-decoding.
	full event: '1 2023-09-20T11:47:57-04:00 pfSense - - - [meta sequenceId="1233"] Sep 20 11:47:56 pfSense suricata[91053]: [1:2027870:5] ET INFO Observed DNS Query to .world TLD [Classification: Potentially Bad Traffic] [Priority: 2] {UDP} 192.168.1.10:45430 -> 192.168.1.1:53'

**Phase 2: Completed decoding.
	name: 'pfsense'
	class: 'Potentially Bad Traffic'
	description: 'ET INFO Observed DNS Query to .world TLD'
	dport: '53'
	dst: '192.168.1.1'
	gid:sid: '1:2027870'
	log: '[1:2027870:5] ET INFO Observed DNS Query to .world TLD [Classification: Potentially Bad Traffic] [Priority: 2] {UDP} 192.168.1.10:45430 -> 192.168.1.1:53'
	priority: '2'
	proto: 'UDP'
	router: 'pfSense'
	service: 'suricata'
	sport: '45430'
	src: '192.168.1.10'
Now that it was verified that the decoders can extract the fields for the different services, all that was left was to create custom rules to match on these fields and have them appear as alerts in the Wazuh dashboard. These rules were added into the /var/ossec/etc/rules/local_rules.xml file.
For Suricata, I created the following rule for all Suricata alerts received:
<!-- Suricata alerts received via syslog -->
<group name="pfsense,ids,suricata">:
    <rule id="100002" level="6">
        <decoded_as>pfsense</decoded_as>
        <field name="service">^suricata$</field>
        <description>Suricata Alert: $(description)</description>
    </rule>
</group>
Then for the Zeek I started with the notice.log log:
<!-- Zeek weird.log received via syslog -->
<group name="pfsense,ids,zeek">:
    <rule id="100011" level="6">
        <decoded_as>pfsense</decoded_as>
        <field name="service">^zeek_notice$</field>
        <description>Zeek: notice.log - $(msg) </description>
    </rule>
</group>
Now with those rules configured, logs should should now generate alerts in the Wazuh Dashboard:
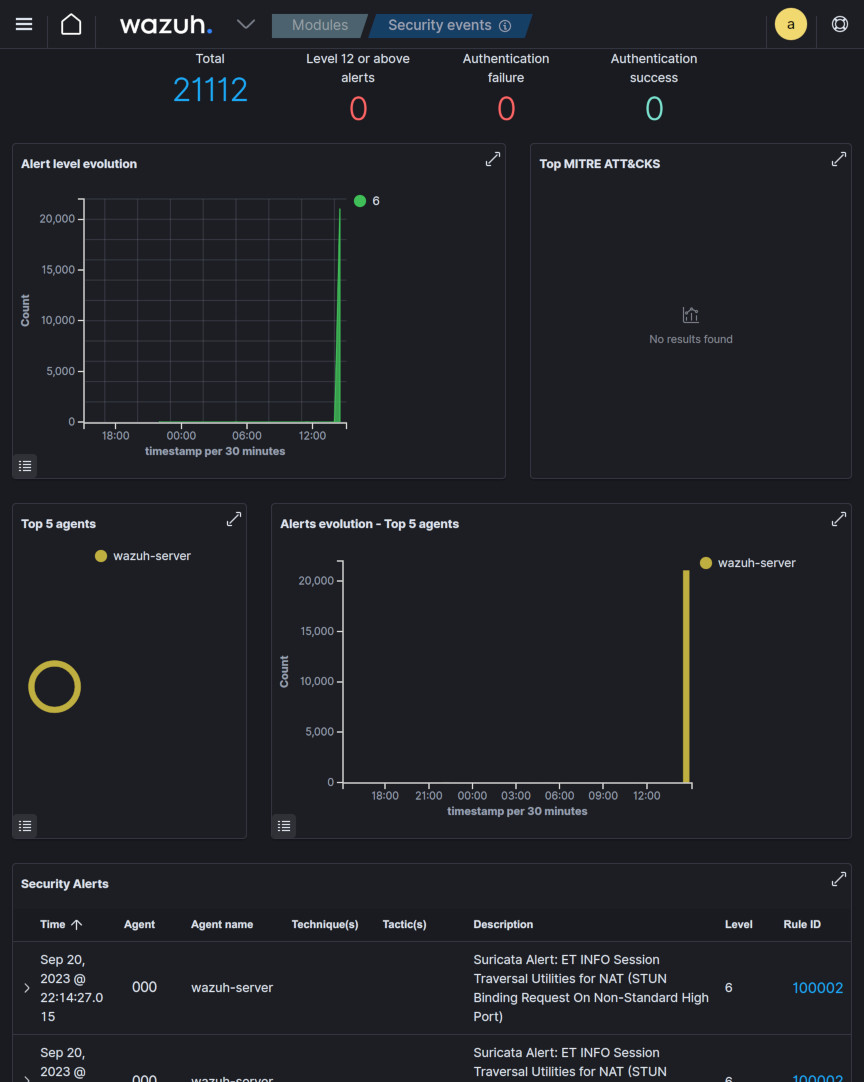
As shown above, there were a substantial amount of alerts generated, most of them likely due to invalid/malformed packets and other miscellaneous/irrelevant activity. This proved that there was some rule-tuning required upstream on the Suricata side to clear out these false positives.
IRIS <- MISP Integration
Next, the native MISP module was configured in IRIS in order to allow any IOCs within IRIS to be enriched with MISP insight.
First, the MISP API key was obtained under Event Actions > Automation in the MISP dashboard.
Then, the IRIS-MISP module configuration was changed via the IRIS Dashboard, under Advanced > Modules > IrisMISP, and the MISP configuration JSON object was modified to the following:
{
   "name":"SOC_MISP",
   "type":"public",
   "url":["http://127.0.0.1:8080"],
   "key":["APIKEY"],
   "ssl":[false]
}
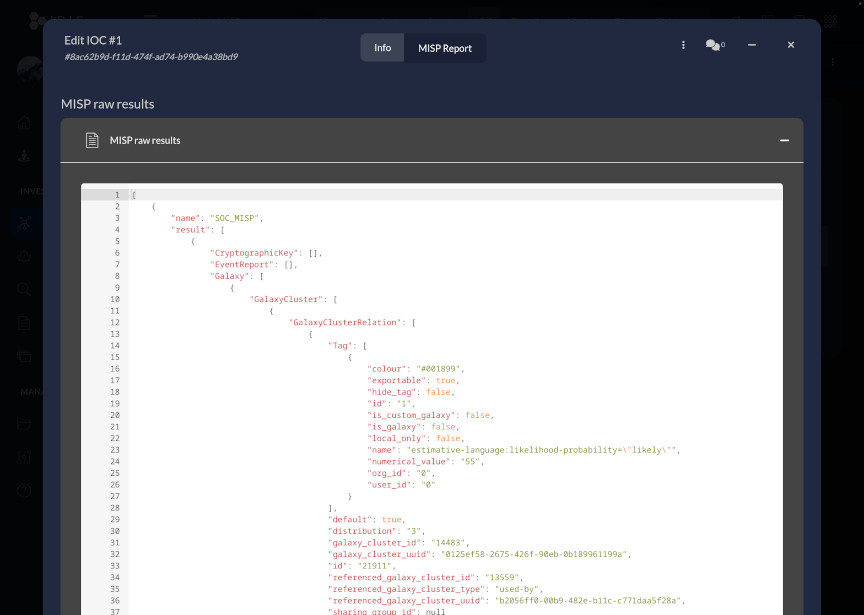
Then, to verify that the module worked, the domain IOC gatewan.com was added to the initial demo case #1 - Initial Demo, and under the drop-down menu, Get MISP Insight was clicked.
The DIM Tasks log showed that the request to MISP was successfully sent, and a report was downloaded into the IOC entry:
Log:
Task ID: 68cb44eb-a8cb-4a33-a82f-077a422b0a68
Task finished on: 2023-09-20 14:08:21.837566
Module name: iris_misp_module
Hook name: on_manual_trigger_ioc
User: administrator
Case ID: 1
Success: Success
Logs
* Retrieved server configuration
* Module has initiated
* Received on_manual_trigger_ioc
* Getting domain report for gatewan.com
* Adding new attribute MISP Domain Report to IOC
* Successfully processed hook on_manual_trigger_ioc
Report:
Wazuh <-> MISP Integration
Next, a custom Wazuh integration was added to in order to allow Wazuh to send API calls to MISP, using this blog post by OpenSecure as reference.
To start off, the following Python script was downloaded into the /var/ossec/integrations directory, changing the misp_base_url and misp_api_auth_key variables to match the environment. Permissions of the script were changed to 750 and ownership to root:wazuh.
Then Wazuh’s /var/ossec/etc/ossec.conf file was modified to include the newly added script into the following integration block:
<integration>
    <name>custom-misp.py</name>
    <group>sysmon_event1,sysmon_event3,sysmon_event6,sysmon_event7,sysmon_event_15,sysmon_event_22,syscheck</group>
    <alert_format>json</alert_format>
</integration>
The wazuh-manager service was then restarted in order to apply the configuration changes.
To finish this integration, new rules were added once again into the /var/ossec/etc/rules/local_rules.xml file, in order for Wazuh to generate alerts for any positive hits received in the response from MISP:
<group name="misp,">
  <rule id="100620" level="10">
    <field name="integration">misp</field>
    <match>misp</match>
    <description>MISP Events</description>
    <options>no_full_log</options>
  </rule>
  <rule id="100621" level="5">
    <if_sid>100620</if_sid>
    <field name="misp.error">\.+</field>
    <description>MISP - Error connecting to API</description>
    <options>no_full_log</options>
    <group>misp_error,</group>
  </rule>
  <rule id="100622" level="12">
    <field name="misp.category">\.+</field>
    <description>MISP - IoC found in Threat Intel - Category: $(misp.category), Attribute: $(misp.value)</description>
    <options>no_full_log</options>
    <group>misp_alert,</group>
  </rule>
</group>
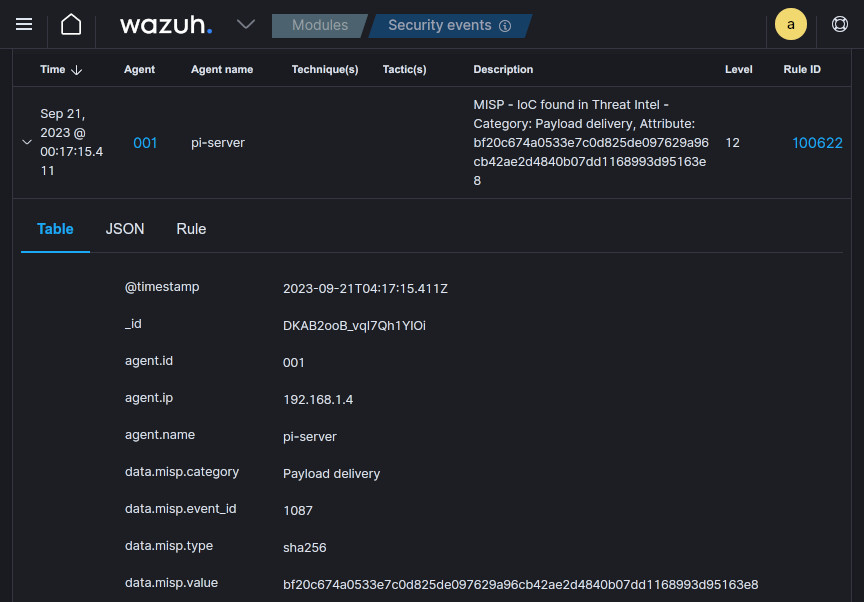
Now, any sysmon/syscheck rules triggered in Wazuh will then subsequently reach out to the MISP API, and should they contain any IOC recognized by MISP, will appear in Wazuh as alerts with enriched data. In the screenshot below, a syscheck_entry_added alert for a sample of the ATMSpitter malware file added to /etc triggers a call containing the SHA256 hash to MISP, which reports back as an alert providing further insights:
Wazuh -> IRIS Integration
🚨 Official Wazuh and DFIR-IRIS integration 🚨
Please note: As of July 3rd 2024, there is now official documentation by Wazuh for integrating IRIS with Wazuh. I highly recommend that you follow that documentation instead of the following.
For the last integration between Wazuh and IRIS, a custom Wazuh integration was to be made once again. However, this time, the integration and associated script were not already made by someone else, so I had to create these from scratch. I used the Wazuh blog post on the integrator tool and the IRIS Alerts API documentation as reference in creating these.
I obtained the IRIS API key from the Dashboard under My Settings.
IRIS versions 2.4.x+
In versions of IRIS 2.4.x and greater, changes were made to access control which affect how alerts are displayed.
You will need to add your IRIS user to the customer for which you are ingesting alerts for to see new entries in the alerts tab.
This can be configured by navigating to Advanced > Access Control under Manage on the left panel, clicking on your user under Users, clicking on the Customers tab, and then Manage to add the customer (should be IrisInitialClient by default on a base install).
The following integration block was added to /var/ossec/etc/ossec.conf, and once again the wazuh-manager service restarted:
<integration>
    <name>custom-iris.py</name>
    <hook_url>http://127.0.0.1:8000/alerts/add</hook_url>
    <level>6</level>
    <group>ossec,syslog,syscheck,authentication_failed,pam,pfsense,suricata,misp_alert</group>
    <api_key>APIKEY</api_key>
    <alert_format>json</alert_format>
</integration>
Then, I created the following Python script and put it in the /var/ossec/integrations/ directory (once again with 750 permissions and root:wazuh ownership) in order for Wazuh to forward alerts to IRIS:
The repository for this script can be found here.
#!/usr/bin/env python3
# custom-iris.py
# Custom Wazuh integration script to send alerts to DFIR-IRIS

import sys
import json
import requests
from requests.auth import HTTPBasicAuth

# Read parameters when integration is run
alert_file = sys.argv[1]
api_key = sys.argv[2]
hook_url = sys.argv[3]

# Read the alert file
with open(alert_file) as f:
    alert_json = json.load(f)

# Extract field information
alert_id = alert_json["id"]
alert_timestamp = alert_json["timestamp"]
alert_level = alert_json["rule"]["level"]
alert_description = alert_json["rule"]["description"]
agent_name = alert_json["agent"]["name"]
rule_id = alert_json["rule"]["id"]

# Convert Wazuh rule levels -> IRIS severity
if(alert_level < 5):
    severity = 2
elif(alert_level >= 5 and alert_level < 7):
    severity = 3
elif(alert_level >= 7 and alert_level < 10):
    severity = 4
elif(alert_level >= 10 and alert_level < 13):
    severity = 5
elif(alert_level >= 13):
    severity = 6
else:
    severity = 1

# Generate request
payload = json.dumps({
    "alert_title": "Wazuh Alert",
    "alert_description": alert_description,
    "alert_source": "Wazuh Server",
    "alert_source_ref": alert_id,
    "alert_source_link": "WAZUH_URL,
    "alert_severity_id": severity,
    "alert_status_id": 2, # 'New' status
    "alert_source_event_time": alert_timestamp,
    "alert_note": "",
    "alert_tags": "wazuh," + agent_name,
    "alert_customer_id": 1, # '1' for default 'IrisInitialClient'
    "alert_source_content": alert_json # raw log
})

# Send request to IRIS
response = requests.post(hook_url, data=payload, headers={"Authorization": "Bearer " + api_key, "content-type": "application/json"})

sys.exit(0)
Now, alerts with a level of 6 or higher in Wazuh should generate the following alerts in IRIS:
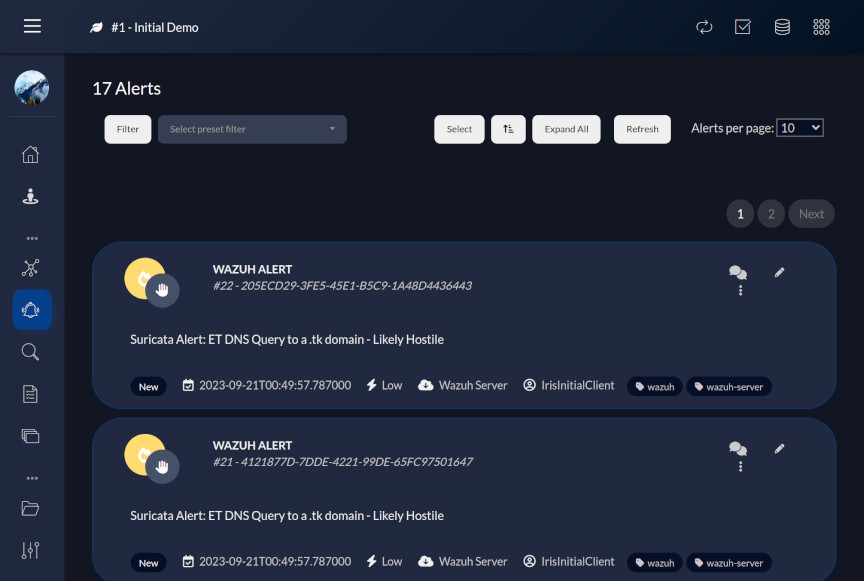
At last, all the SOC components have been set up to talk to each other and a basic workflow/playbook implemented leveraging automation to streamline the incident response and threat hunting process.
What’s Next?
Since the time I’ve set up this SOC and basic playbook, I’ve spent time learning the ins and outs of the various different tools, inching towards to using them to their full potential.
Rules within Wazuh and Suricata were tuned to remove false positives and improve detection for anything that wasn’t monitored out of the box, I spent time learning about threat intelligence terminology to better utilize MISP, switched Suricata’s logging to EVE for the extended information, started developing a mindset or methodology for handling cases/incidents in IRIS as the “SOC Analyst”, and carried out a few simulated attacks using this workflow.
Looking forward, I plan to continue to evolve this environment, incorporating complex systems typically found in enterprise environments; Data loss prevention (DLP) and User and entity behavior analytics (UEBA) are 2 domains in particular that I will seek into incorporating into the SOC. In addition, I also plan to implement a more proactive response to alerts, now that a major part of the false positives have been suppressed, so that the majority of “low-hanging fruit” attacks are blocked. Lastly, I would also like to add a malware analysis sandbox to the SOC in order to be able to analyze any potential malware samples detected on the network.
That being said, these are just a few ways in which I could go about further augmenting the SOC.
Conclusion
Hey, thanks for making it to the end. Hopefully this write-up has helped provide some inspiration to those interesting in building out their own SOC lab.
I did overcome few challenges in getting everything set up, such as wresting with Docker networking, getting the regex right on the Wazuh decoders and rules, and debugging the IRIS Wazuh integration Python script.
Overall, I am quite pleased with how the SOC turned out and the ability it has given me to further develop my skills; I am pretty confident it will be great source of self-education for years to come.