Analyzing Device Network Connections
🗓️ December 31st, 2024
⏳ 6 min. read
Table of Contents
Hello! It’s been a while. In this post I am bringing you some ways that you can go about investigating open connections on a device, whether out of curiosity as to what apps/programs are making internet connections, or to try to find suspicious activity.
Specifically, I will be showcasing some existing tools/utilities and demonstrate how they can facilitate this task, with some advanced tools even having the capability to block unknown/suspicious connections.
Addressing the Elephant in the Room
The main drawback to analyzing connections from the device itself is that it is not guaranteed you will have 100% visibility into all the network traffic that is going in or out of the device — Especially if the device has already been compromised. Ideally, you would want to have a network device such as a Network Intrusion Detection System (NIDS) or packet analyzer in between the device and the network perimeter to be able to see all traffic coming in/out from that specific NIC (Network Interface Card).
With that in mind, in the next section I will delve into some utilities that should be a part of your tool belt when analyzing connections on a device.
Analysis Tools
”ss” Command
The ss (socket statistics) command is a Linux CLI tool that brings a ton of capabilities to investigate all types of sockets. Running the ss command without any arguments may seem overwhelming, but we may begin simplifying this by running ss -tanp, which should show all TCP connections with their associated process:
State      Recv-Q     Send-Q     Local Address:Port     Peer Address:Port     Process
LISTEN     0          100            127.0.0.1:25            0.0.0.0:*         users:(("master",pid=2584,fd=13))
LISTEN     0          80             127.0.0.1:3306          0.0.0.0:*         users:(("mariadbd",pid=3559,fd=16))
LISTEN     0          128              0.0.0.0:22            0.0.0.0:*         users:(("sshd",pid=874,fd=3))
ESTAB      0          0            192.168.1.4:22        192.168.1.3:46378     users:(("sshd",pid=1302078,fd=4),("sshd",pid=1302025,fd=4))
LISTEN     0          100                [::1]:25               [::]:*         users:(("master",pid=2584,fd=14))
LISTEN     0          128                 [::]:22               [::]:*         users:(("sshd",pid=874,fd=4))
LISTEN     0          511                    *:80                  *:*         users:(("apache2",pid=1300696,fd=4))
LISTEN     0          511                    *:4443                *:*         users:(("apache2",pid=1300696,fd=8))
LISTEN     0          511                    *:443                 *:*         users:(("apache2",pid=1300696,fd=6))
Looking at the line with the ESTAB or established connection, we see that it is an SSH connection active (based on the port and process ID); this is the SSH connection I am using to connect to this server, so nothing out of the ordinary here.
For a deeper dive on the ss command and how to use it to its full potential, I’d recommend reading these articles from SANS and Linux Audit.
”netstat” Command
Similarly, on the Windows side, the netstat command is available to list active connections. Running netstat -noab -p tcp yields the similar results as the ss command:
Active Connections

  Proto  Local Address          Foreign Address        State           PID
  TCP    0.0.0.0:135            0.0.0.0:0              LISTENING       892
  RpcSs
 [svchost.exe]
  TCP    0.0.0.0:445            0.0.0.0:0              LISTENING       4
 Can not obtain ownership information
  TCP    0.0.0.0:5040           0.0.0.0:0              LISTENING       5376
  CDPSvc
 [svchost.exe]
  TCP    0.0.0.0:7680           0.0.0.0:0              LISTENING       1368
 Can not obtain ownership information
  TCP    0.0.0.0:49664          0.0.0.0:0              LISTENING       872
 [System]
  TCP    0.0.0.0:49665          0.0.0.0:0              LISTENING       680
 Can not obtain ownership information
  TCP    0.0.0.0:49666          0.0.0.0:0              LISTENING       1620
  EventLog
 [svchost.exe]
  TCP    0.0.0.0:49667          0.0.0.0:0              LISTENING       1548
  Schedule
 [svchost.exe]
  TCP    0.0.0.0:49668          0.0.0.0:0              LISTENING       3448
 [spoolsv.exe]
  TCP    0.0.0.0:49676          0.0.0.0:0              LISTENING       844
 Can not obtain ownership information
  TCP    192.168.1.50:139       0.0.0.0:0              LISTENING       4
 Can not obtain ownership information
  TCP    192.168.1.50:49700     52.159.127.243:443     ESTABLISHED     3940
  WpnService
 [svchost.exe]
  TCP    192.168.1.50:49824     52.159.127.243:443     ESTABLISHED     10076
 [OneDrive.exe]
  TCP    192.168.1.50:49843     52.159.127.243:443     ESTABLISHED     3940
  WpnService
 [svchost.exe]
  TCP    192.168.1.50:51398     52.113.194.132:443     ESTABLISHED     3464
 [OneDriveStandaloneUpdater.exe]
  TCP    192.168.1.50:51400     10.10.10.1:443         SYN_SENT        6692
  BITS
 [svchost.exe]
  TCP    192.168.1.50:51401     10.10.10.1:443         SYN_SENT        11040
 [FileSyncHelper.exe]
  TCP    192.168.1.50:51402     10.10.10.1:443         SYN_SENT        11040
 [FileSyncHelper.exe]
  TCP    192.168.1.50:51403     10.10.10.1:443         SYN_SENT        2636
 [FileCoAuth.exe]
In this example, there appears to be multiple established HTTPS connections of Windows processes to Microsoft IPs, so nothing stands out as suspicious here!
For macOS
Although there is also a netstat command on macOS, it does not follow the same syntax as the Windows netstat. Since I don’t have any Mac devices to demonstrate any examples, I’ll defer to the following article by Lifewire which provides a comprehensive walk-through of netstat and lsof to analyze connections on Mac.
Sniffnet
For something more user-friendly, Sniffnet is a cross-platform GUI application that makes it easy to visualize network traffic and connections, and even has the ability to perform a packet capture for further analysis in a packet analyzer such as Wireshark.
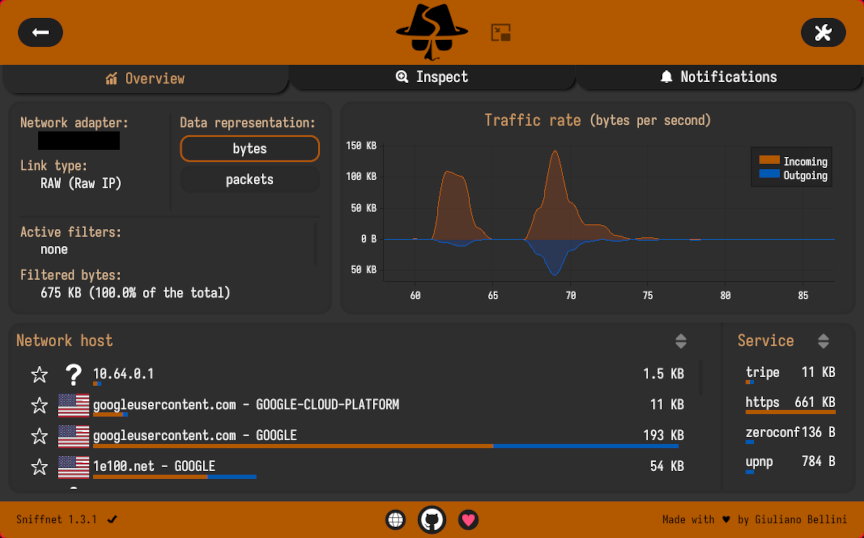
From the captured data, we should be able drill-down on anything interesting via the Inspect tab and determine if anything looks out of the ordinary:
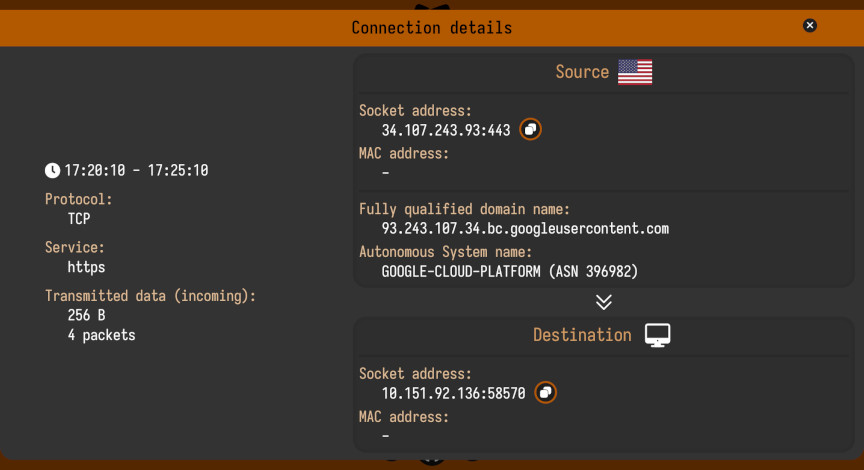
Another neat feature is that Sniffnet will “monitor over time”, whereas the ss and netstat commands only show connections at the time they are run — A benefit to this would be being able to detect unusual connections that only occur at certain intervals or at a specific time of day.
The biggest downside (in my opinion) is currently (as of version 1.3.1) the program does not associate/show the processes/PIDs that are creating/using the connections. Hopefully in the future this gets implemented.
Ok, now with some tools to help detect and analyze connections, let’s move on to some tools that will assist us in blocking suspicious/unwanted outbound connections.
Connection Blocking/Application Firewalls
Portmaster
Portmaster is an application firewall for Linux & Windows that also comes bundled with a “privacy filter” that blocks connection to known malicious/unwanted hosts, a secure DNS configuration, a network monitor, and a VPN-like feature called a SPN that allows for each app on a system to be tunneled separately.
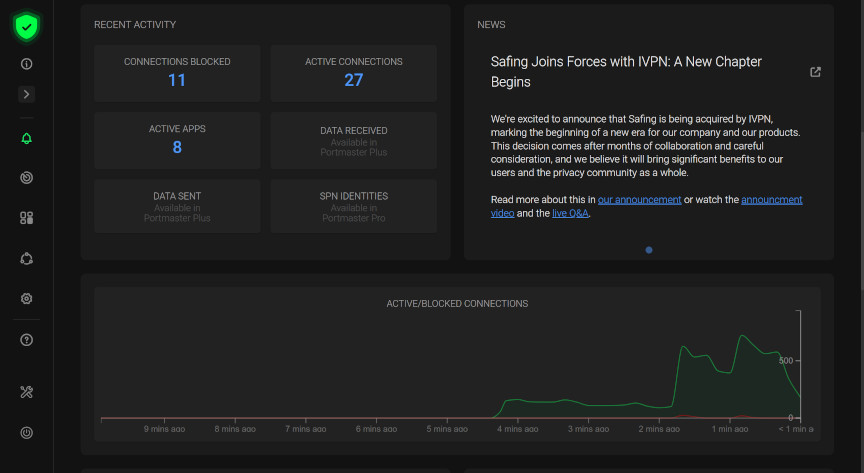
It appears to be one of the more user-friendly and “modern-looking” application firewalls currently available, while also possessing some more in-depth and granular configuration. The really neat feature (as it relates to network analyzing) is that it is able to log connections per process/app and block any undesired connections. In the below example, I have configured a rule to block connections from the curl app/command to the domain testsite.com:
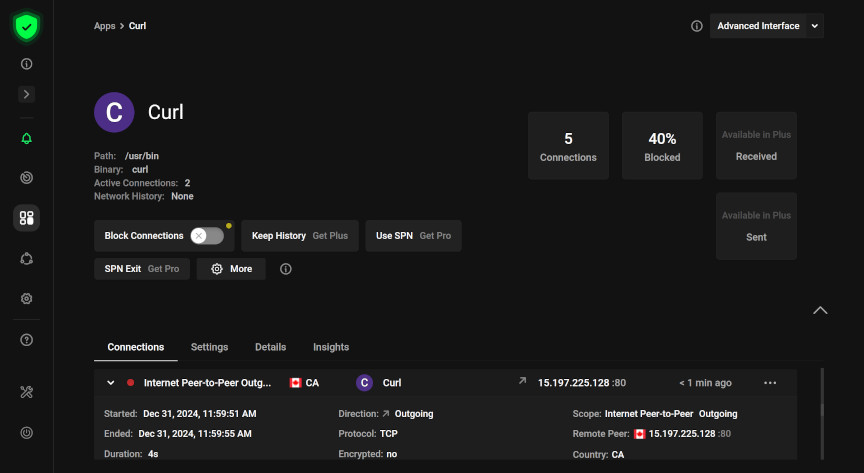
The main drawback of Portmaster in regard to network monitoring is that by default on the “free” version/plan only the 10 latest minutes of network history are maintained at any time, meaning that you may miss some information. Additionally, by default (and understandably so for newcomers), Portmaster does not notify you of new apps attempting to connect outbound and ask whether to allow or deny those connections and rather allows all (except the block lists) — You have to change the “Default Network Action” setting to Prompt. Some other quirks and minor complaints that others have also shared is that Portmaster does appear to be a bit bloated, in both resource utilization and features, as it tries to accomplish a lot.
OpenSnitch
OpenSnitch (inspired by Little Snitch for macOS) is an application firewall for Linux that in contrast to Portmaster, focuses its strengths on the application firewall aspects. While perhaps not as intuitive or “ready out of the box” as Portmaster, you do have access to all network events that are allowed/denied and overall gives you better holistic view of the system’s network connections.
It does require more initial setup, as on the first start by default you will be prompted with pop-ups of OpenSnitch intercepting connections of programs running on the system, asking you do deny or allow them; in a way you have to “teach” OpenSnitch which programs are allowed to connect outbound. Alternatively you can change the default behavior to allow with pop-ups disabled and passively obtain information on what the system is doing, and then you can “lock things down”.
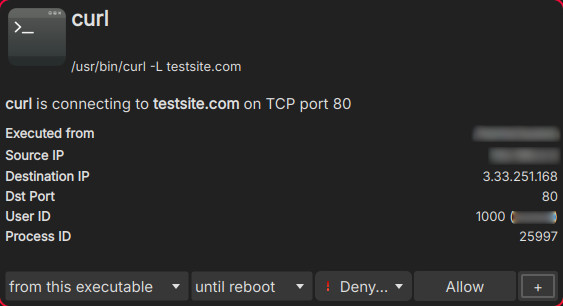
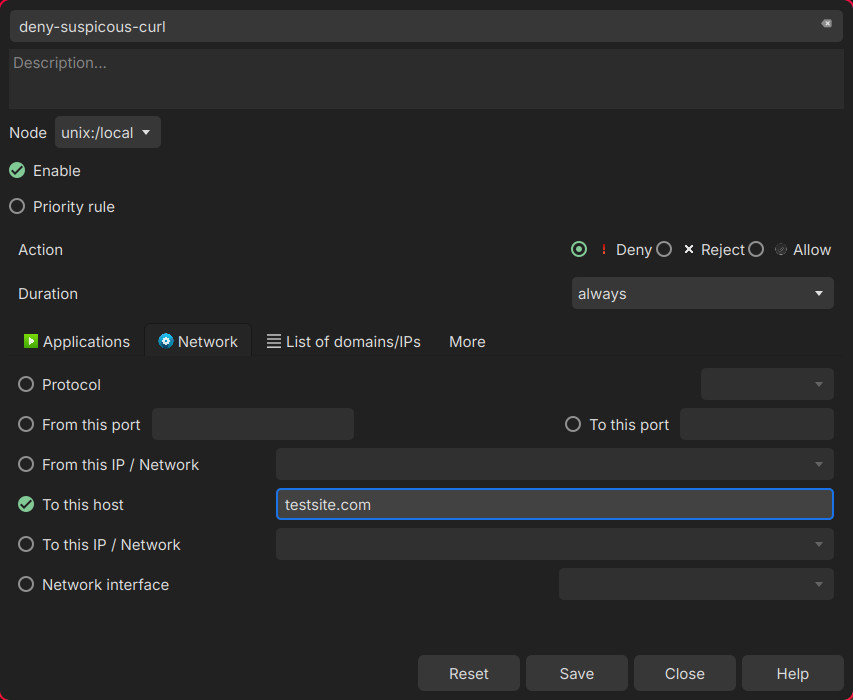
The same rule that was created on Portmaster was replicated on OpenSnitch, to block connections from the curl command to the testsite.com domain:
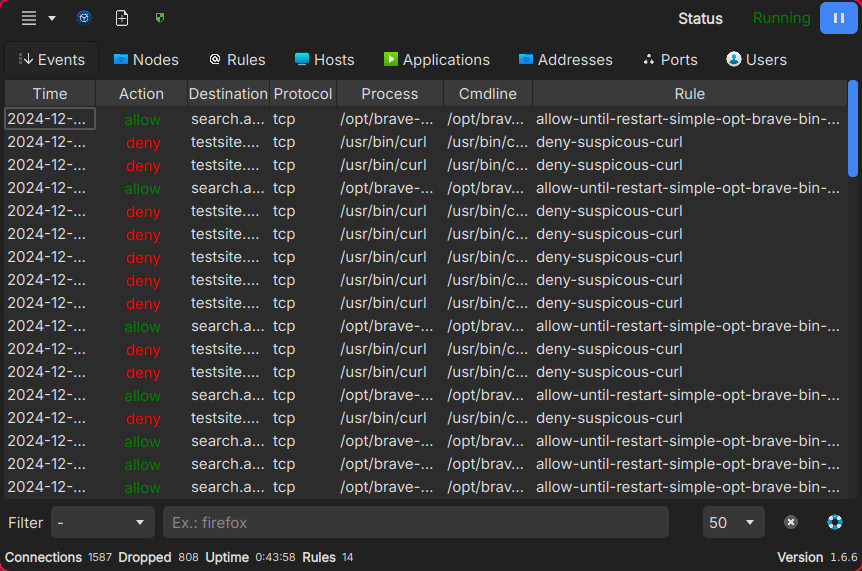
Then, in the event viewer for OpenSnitch, we can see that attempts have been blocked/denied:
Another cool feature of OpenSnitch is the ability for multi-node management, meaning that it can be installed on devices that don’t possess a GUI (a server for example) and can be managed from a device that has the GUI application. Lastly, it also has SIEM integration! It’s not to say that it is a full-on replacement for an endpoint monitoring solution such as an EDR/XDR, but it’s pretty neat nonetheless.
A few drawbacks of OpenSnitch is the lack of a “fancy” graph/chart to visualize traffic activity, does not come pre-bundled with any block lists (which may be a pro for advanced users who want full control), and may suffer from the occasional bug, as it is still in active development.
Honorable Mentions
There were some tools/utilities that were omitted, in sake of keeping this a short read. Here are other options that I would recommend also taking a look at:
- bandwhich: A CLI utility for Linux, Windows, & macOS for displaying network utilization.
- simplewall: A lightweight application firewall for Windows.
- LuLu: An application firewall (bundled with a network monitor) for macOS.
- picosnitch: A network monitor for Linux inspired by OpenSnitch, with a focus on reliability and detectability.
- RethinkDNS: A feature-rich Android app that bundles an application firewall, network monitor, and more.
Closing
You’ve reached the end! — I hope this post has helped provide some practical examples of tools that can be used to examine network connections and tools that can block any suspicious or unwanted apps. Remember that these tools are not all-encompassing, but only a portion of a greater infosec strategy/posture.